The Top Hat Guide to Intentional Course Design offers tools and inspiration for applying these strategies to your own teaching.
Download the Free GuideTHE RESEARCH BEHIND TOP HAT
Top Hat Fuels Student Persistence and Success at Scale
Our platform—supported by published studies—fosters engagement and drives meaningful student outcomes.

Courses Where Top Hat Was Used at Indiana University Saw an 11.5% Lower Student Withdrawal Rate
At Indiana University, Top Hat Usage Lowers Withdrawal Rates by 11.5%
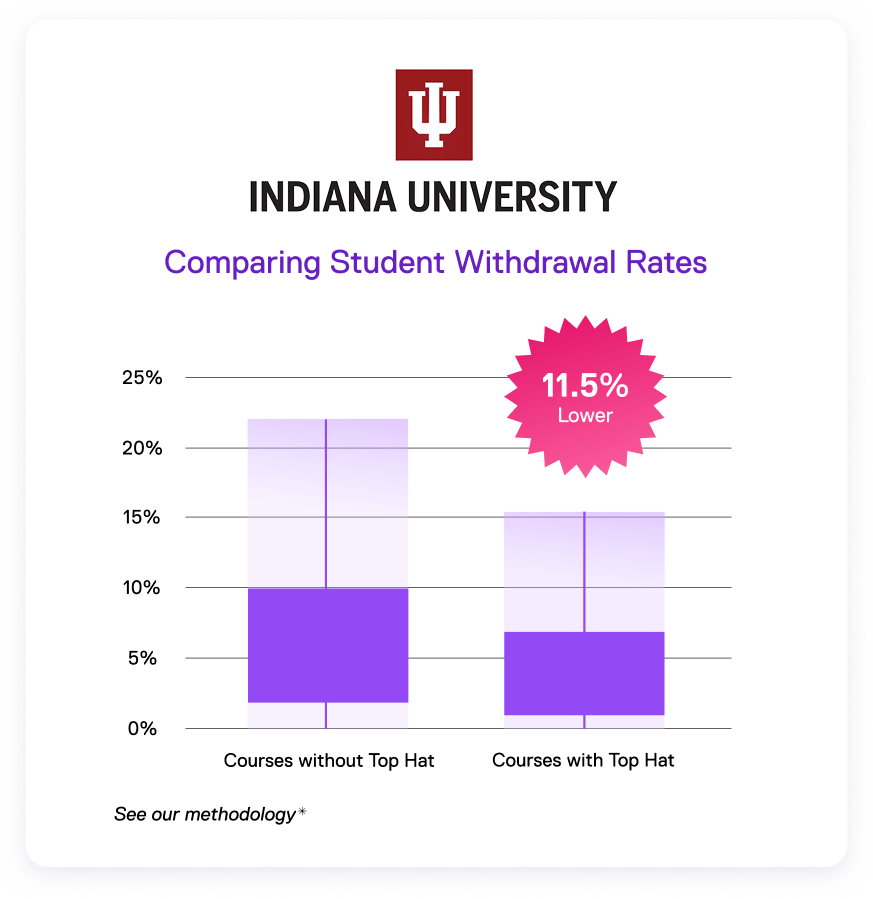
Courses Where Top Hat Was Used at Indiana University Saw an 11.5% Lower Student Withdrawal Rate
Since 2018, Indiana University has provided universal access to Top Hat’s student engagement platform across nine campuses, reaching more than 51,000 students annually.
In a 2023 IRB-approved study, researchers compared 235 Top Hat courses with 235 equivalent non-Top Hat courses and found an 11.5% lower student withdrawal rate in courses using Top Hat. Given the risks of delayed graduation, financial aid loss, and potential dropouts, these findings underscore the critical impact Top Hat can have on student success.
BY THE NUMBERS
Top Hat Usage at Indiana University in 2023
51,679 Students
1,900 Courses
1,022 Faculty
Learn More About the Partnership

Press Release

Infosheet

Infosheet
Educator Story
Real Classrooms, Real Results
Explore published research from educators who leverage active learning strategies and Top Hat to generate measurable improvements for their students.
1. Engagement Raises Exam Scores
All Students Can Benefit from a Personal Response System Pedagogy that Encourages Active Engagement Yet Lowers Barriers to Implementation
Brian K. Hornbuckle, Asimoula Valai, Audrey L.
McCombs & Elizabeth A. Griffin
Journal of Science Education and Technology
Brian K. Hornbuckle
Department of Agronomy
Iowa State University


Key Findings:
•
Students who answered more questions using a Personal Response System (Top Hat) generally earned higher grades (those who earned A before B)
•
Response rate has a significant impact on total exam scores. A 15% increase in response rate was estimated to raise total exam points by 7 for C students, 14 for B students, and 17 for A students (out of 400 possible points)
2. Increased Openness and Inclusivity
Engagement in Cross-Cultural Large Lecture Classrooms: Using Top Hat Technology to Include Students in the Discussion
RayeCarol Cavender and Trina Gannon (2019),
Journal of Human Sciences and Extension
RayeCarol Cavender
Human Environmental Sciences
University of Kentucky
Trina Gannon
Consumer Sciences
Ohio University


Key Findings:
88%
of respondents agreed that Top Hat’s anonymity allowed them to respond more honestly
78%
of respondents agreed that Top Hat was important to their level of engagement with course content
3. Higher Critical Thinking Scores
Technology and the Post-Secondary Classroom: A Critical Inquiry into BYOD Student Experience in Human Sexuality
Matt Numer and Rebecca Spencer (2016),
International Journal of Technologies in Learning
Matt Numer
Human Sexuality
Dalhousie University
Becky Feicht
Human Sexuality
Dalhousie University


Key Findings:

Students scored significantly higher on a critical thinking test after using Top Hat (n=47)
•
Students strongly agreed that Top Hat facilitated engagement, allowed more comfortable responses to sensitive material, and added value by seeing peers’ perspectives. (Survey n=152)
Learning Science-Backed Products and Services
Our mission is to spark better teaching and learning for a brighter world. That’s why every aspect of our platform, content, and services is driven by evidence-based design.
Beyond Polling: Formative Assessment for Deeper Learning
Evaluate student understanding at every level of Bloom’s Taxonomy using active learning strategies like peer learning, think-pair-share, and entry/exit tickets.

Interactive eTexts Built the Way Students Learn Best
Our eTexts come packed with formative assessments and retrieval-practice activities to keep students engaged and reinforce key concepts.

Proven Teaching Strategies Drive Our Onboarding and Support
Our instructional design team partners with faculty to create impactful learning experiences grounded in evidence-based methods like interleaving, retrieval practice, and data-informed iteration.

*The 11.5% relative difference between withdrawal rates was calculated by dividing 0.77% (the absolute difference in mean withdrawal rates between the courses that did not use Top Hat and the courses that did) by 6.66% (the mean withdrawal rate of courses that did not use Top Hat), and expressing the result as a percentage.