Deborah Carroll is a Psychology professor at Southern Connecticut State University and contributing author of a chapter of Top Hat’s interactive text Statistics for Social Science.
In the latest instalment of our webinar series, Why Innovative Educators Are Using Interactive Content, she talked about the lesson structure behind how she teaches a particular statistical concept—and how she worked with other academic collaborators in video and in app development to make her text compelling and memorable.
-
-
Video introduction
-
Statistics for Social Science is a book for students in their first year of social science or psychology courses, introducing them to methods of statistical analysis. Carroll’s chapter is on ANOVA (the analysis of variance test).
ANOVA is used to calculate how closely three or more datasets are related. The technique is introduced with this video in Carroll’s chapter, hosted by fellow textbook collaborator Professor Allistair J. Cullum of Creighton University.
Carroll explains: “I really wanted to make this hands-on for students, and very practical. They can see how ANOVA works in real life, not just in a math stats class.”
The purpose of the video is to prepare the ground for learning the math, and the cases that ANOVA can best be applied to.
“I often assign it as homework,” says Carroll.
-
-
Learning checks
-
Right after the video, an embedded quiz appears:
Learning checks offer students the chance to make sure they understand before they proceed—and to practice. pic.twitter.com/nJ5MWpQCqM
— Top Hat (@TopHat) July 11, 2017
This is a matching question that asks students to pair premises with the right responses. Carroll explains the reasoning behind the placement: “The learning checks give students practice halfway through each chapter to say, ‘Hmm, did I really understand that?’.”
Another benefit of placing learning checks right in the text, she adds, is that it makes students more comfortable with actual graded questions when they appear.
-
-
Let them experiment
-
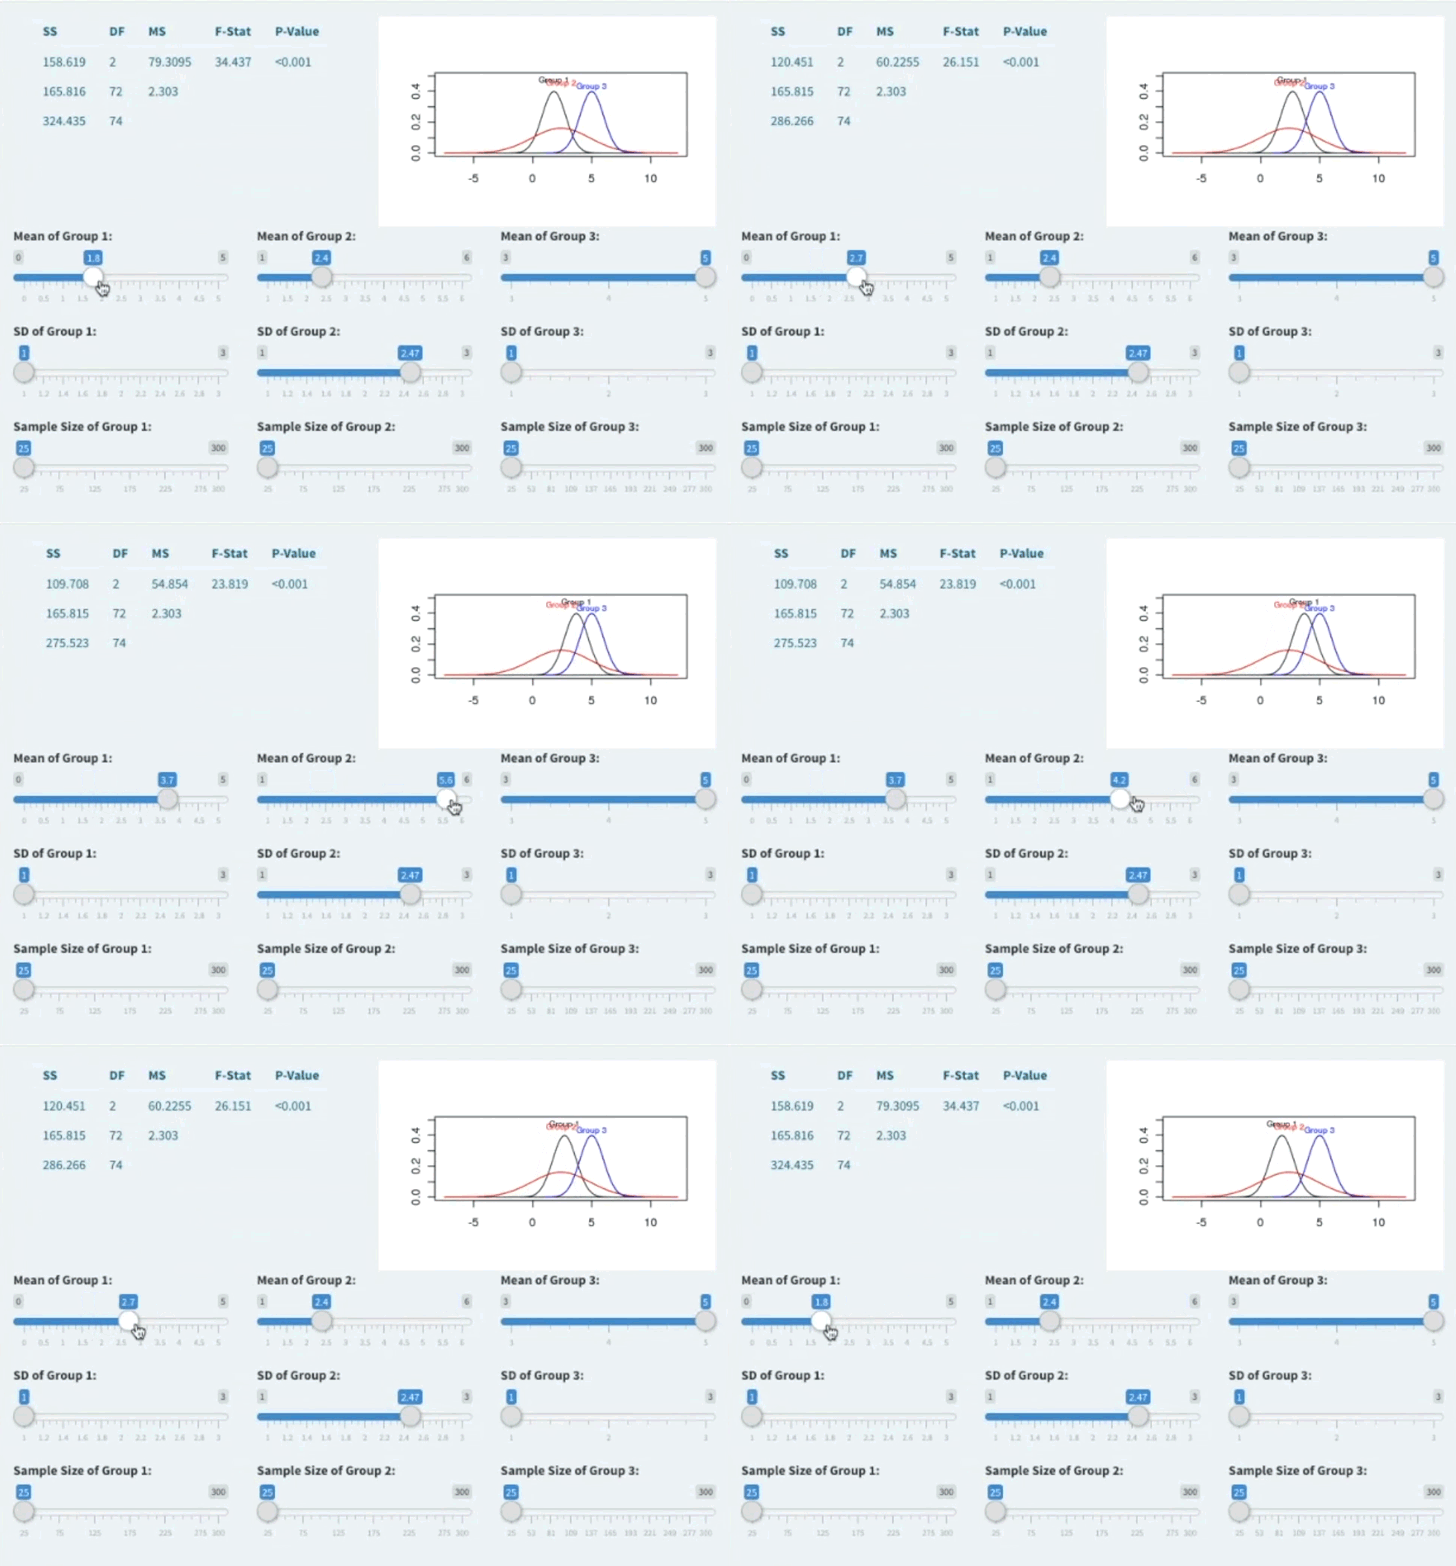
An embedded app created by Dr. Adam Sullivan, also on the authoring team of Statistics For Social Science, allows students to alter attributes of three groups (such as the group mean and the standard deviation) to see how the F-statistic—the result of the ANOVA test—changes.

“By playing with the means and standard deviation or other variability, they can actually see how that impacts the F-statistic,” Carroll says.
-
Real life examples
A video from an applied example—how infectious disease is spread and measured—shows how ANOVA is used. It is an important part of the chapter because students can connect the information they’re learning with the results they see from analysis.
According to Carroll “students often come to stats saying, ‘Why do I need to know this? I’m never going to use it. No one uses this in the real world.’
Now students can see “how in the real world people use statistical analysis and what they learn… [They] find it very interesting and again, it clicks: ‘Oh, that’s what you do with it.’”
Each chapter of the book contains case studies which take the statistical procedures taught and show the practical applications. “It’s a great segue into research methods,” Carroll says.
It’s easier than you think to build your own interactive textbooks. Let our free guide, How to Create Interactive Course Content, show you how.


